Analytics and KPI in e-commerce, the guide to manage your store with the right indicators!
⚡ In short: the 5 essential points to remember
No time to read it all? Here's the gist of this 30-second guide:
- Focus on a maximum of 10 KPIs — No need to track 50 metrics. Successful online retailers track 2-3 indicators per category (acquisition, conversion, retention, profitability) and ignore the rest.
- The winning trio: CAC < Marge < CLV — Your business is viable if your Customer Acquisition Cost is lower than your margin on the first sale, and if your Customer Life Value is at least 3 times higher than your CAC. It is the golden rule of profitability.
- A minimum ROAS of 4:1 to be profitable — In 2025, with an average margin of 60%, aim for a return on advertising investment of at least €4 earned for €1 spent. Below 2:1, you're losing money.
- Centralize everything in a single dashboard — Stop juggling 5 tools. Use Google Looker Studio (free) to combine Google Analytics, Shopify, Facebook Ads, and other data sources into a single dashboard that you can access every week.
- Segment to find the hidden gold — Your overall conversion rate often hides big disparities. Segment by traffic source, device, and geography to identify where you're really performing (and where you're wasting your budget).
Try copyfy for free
You spend hours looking at your Google Analytics stats, your Shopify dashboard, your Facebook Ads reports... but you don't really know what to get out of them? Are you drowning in a mass of numbers without knowing which ones are really important for growing your business?
Good news: you don't need to track 50 different metrics. Successful online retailers focus on a handful of key indicators that allow them to make the right decisions quickly. In this guide, we will explain to you exactly which KPIs to follow, how to calculate them, and especially what concrete actions to take according to their values.
Try copyfy for free
Understanding the role of KPIs in e-commerce
Before we dive into the numbers, let's clarify what a KPI really is.
A KPI (Key Performance Indicator) is a key performance indicator that measures the effectiveness of an action in relation to a specific objective. It is the difference between:
- Raw data : 1,247 visitors to your site yesterday
- A metric : 65% bounce rate
- A KPI : Conversion rate of 2.8% (below your target of 3.5%)
The KPI not only tells you “where you are” but also “if you are on the right track”. This is what allows you to go from “I have stats” to “I know what to improve”.
Why is it crucial? Because good analytical management allows you to:
- Quickly detect what works (and invest in it)
- Identify leaks in your sales funnel
- Make decisions based on facts, not hunches
- Optimize your advertising budget in real time
- Anticipate problems before they impact your turnover
Without clear KPIs, you're browsing blindly. With the right indicators, you pilot your business like a plane with all its on-board instruments.
Try copyfy for free
The 4 main families of KPIs to follow in your e-commerce store
To simplify, all e-commerce KPIs are grouped into 4 main categories. Each answers an essential question:
CategoryKey QuestionKPI ExamplesObjectiveKey ToolsAcquisitionWhere do my visitors come from and how much does it cost? Traffic, CAC, CTR, CPCAttract qualified traffic at the best costGA4, Meta Ads, Google AdsConversionAre my visitors buying? Conversion rate, AOV, cart abandonment rateTurning traffic into paying customersShopify, GA4, HotjarLoyaltyAre my customers coming back? CLV, Buy-back Rate, Churn RateMaximize lifetime value and retentionKlaviyo, CRM, ShopifyProfitabilityAm I making money? Gross margin, ROAS, CLV/CAC ratioOptimize overall ROI and profitabilityLooker Studio, Triple Whale
The secret? Don't try to keep track of everything at once. Select 2-3 KPIs per category based on your current goals. If you're launching your store, focus on acquisition and conversion. If you already have traffic, optimize your loyalty and your profitability.
Try copyfy for free
The essential KPIs to follow (with formulas and concrete actions)
Now let's get down to business. Here are the indicators that you must absolutely follow, with for each one: the definition, the formula, where to find it, the 2025 benchmarks, and especially the actions to be taken.
1. The conversion rate
Definition: This is the percentage of visitors who make a purchase on your store.
Formula:
(Number of orders/Unique visitors) × 100
Where to find it:
- Shopify: Analytics > Reports > Behavior > Conversion
- GA4: Reports > Monetization > E-Commerce Purchases
2025 Benchmarks:
- Average: 2.5-3%
- Good level: 4%
- Excellent: 5% +
Concrete action:If your rate is below 2.5%, it is because there is friction in your buying process. Start with:
- Optimize your product sheets (descriptions, photos, customer reviews)
- Simplify your checkout process (fewer steps = more conversions)
- Add reassurances (free delivery, warranty, trust badges)
- Test different versions of your CTAs
💡 Pro tip: Never look at your overall conversion rate alone. Segment it by traffic source (Instagram vs Google vs Email) to identify where you convert best.
2. Customer Acquisition Cost (CAC)
Definition: How much do you spend on average to acquire a new paying customer.
Formula:
Total marketing expenses/Number of new customers
Where to find it:
- Manual calculation: add up all your advertising costs (Facebook Ads + Google Ads + influencers, etc.) and divide by the number of first orders over the period
- Triple Whale or Northbeam give you this number directly
2025 Benchmarks:
- Average: 40-60€
- Good level: 25-40€
- Excellent: <25€
Concrete action:Your CAC should always be less than your margin on the first order, ideally 3 times lower. If your CAC is too high:
- Optimize your advertising creativity (test new videos, hooks, formats)
- Improve your targeting (exclude audiences that don't convert)
- Work on your conversion rate to make the same traffic profitable
- Develop free or cheaper acquisition channels (SEO, email, organic)
3. Customer Lifetime Value (CLV or Customer Lifetime Value)
Definition: The total turnover that a customer generates during their entire “life” with your brand.
Simplified formula:
Average cart × Average number of purchases × Average customer lifespan
Quick formula:
(AOV × Purchase Frequency) × Average Lifespan
Where to find it:
- Shopify: Analytics > Reports > Customers > CLV
- Klaviyo: in customer segments
- Manual calculation if you are a beginner
2025 Benchmarks:
- Average: 150-250€
- Good level: €300-500
- Excellent: 500€+
Concrete action:Your CLV must be at least 3 times higher than your CAC. If it is not the case:
- Develop a loyalty strategy (points program, VIP club)
- Launch reactivation campaigns by email
- Create bundles or subscriptions to increase purchase frequency
- Offer complementary upsell/cross-sell products
The magic ratio to watch out for: CLV/CAC. If it is greater than 3:1, your business is healthy and scalable.
Try copyfy for free
4. ROAS (Return On Ad Spend)
Definition: The return on advertising investment. How much do you earn for each euro spent on advertising.
Formula:
Revenue generated by ads/Cost of ads
Where to find it:
- Facebook Ads Manager: “Purchase conversion value/Amount spent” column
- Google Ads: Campaigns > Columns > Return on ad spend
- Shopify+ GA4: in attribution reports
2025 Benchmarks:
- Minimum viable: 2:1 (you earn €2 for €1 spent)
- Good level: 4:1
- Great: 6:1 +
Concrete action:If your ROAS is below 2:1, your business is not profitable on paid traffic. Two options:
- Improve your ROAS:
- Refine your advertising targeting (retargeting first)
- Test creative news (advertising fatigue kills your ROAS)
- Optimize your landing page to increase conversion
- Increase your margin:
- Negotiate with your suppliers
- Increase your prices (if your perceived value allows it)
- Optimize your logistics costs
💡 Attention: The “acceptable” ROAS depends on your margin. With a margin of 70%, a 2:1 ROAS may suffice. With a margin of 30%, you need at least 4:1.
5. The cart abandonment rate
Definition: The percentage of visitors who add a product to the cart but don't complete their purchase.
Formula:
(1 - (Orders finalized/Carts created)) × 100
Where to find it:
- Shopify: Analytics > Reports > Behavior > Sales Funnel Analysis
- GA4: Reports > Monetization > E-Commerce Shopping Journey
2025 Benchmarks:
- Average: 70-76%
- Good level: < 70%
- Excellent: < 60%
Concrete action:A high rate indicates friction when paying. The main causes:
- Shipping costs that are too high or hidden until the last moment
- Checkout process too long or complicated
- Lack of reinsurance (secure payment, return policy)
- Obligation to create an account
Immediate solutions:
- Show delivery costs from the product page
- Offer payment as a guest
- Add trust badges (secure payment, satisfied or refunded)
- Launch abandoned cart recovery email campaigns with a promo code
6. Customer repurchase/retention rate
Definition: The percentage of customers who make a second purchase (or more) on your store.
Formula:
(Customers with 2+ orders/Total customers) × 100
Where to find it:
- Shopify: Analytics > Reports > Customers > Recurring Customers
- Klaviyo: customer segments by number of orders
2025 Benchmarks:
- Average: 20-30%
- Good level: 35-40%
- Excellent: 45% +
Concrete action:Retention costs 5 times less than acquisition. If your repurchase rate is low:
- Create a loyalty program (points, exclusive discounts)
- Segment your emails according to buying behavior
- Send post-purchase emails to maintain the relationship (tips for use, complementary products)
- Offer exclusive offers to your best customers
- Develop a community around your brand (Facebook group, Discord)
Tip: Also measure the “time between two purchases” to identify the optimal moment to follow up with your customers.
7. Gross Margin and Net Margin
Definition:
- Gross margin: What do you have left after paying the cost of the products sold
- Net margin: What you have left after ALL the costs (product + marketing + logistics + miscellaneous expenses)
Formulas:
Gross margin = ((Selling Price - Product Cost)/Selling Price) × 100
Net margin = ((Total Sales - All Costs)/Total Sales) × 100
Where to find it:
- Manual calculation with Excel/Sheets
- Shopify: Financial reports (if set up correctly)
- Your accountant (for the precise net margin)
2025 Benchmarks:
- Gross margin: 50-70% (ideal for e-commerce)
- Net margin: 10-20% after all costs
Concrete action:Without margin, there is no viable business. If your margins are too low:
- On the gross margin:
- Negotiate with your suppliers (volumes, conditions)
- Increase your prices (test gradually)
- Reduce production costs (optimized sourcing)
- On the net margin:
- Optimize your advertising spend (ROAS)
- Reduce delivery costs (carrier negotiations)
- Automate what can be automated (emails, customer service)
- Eliminate unprofitable products
💡 Golden rule: Aim for a gross margin of at least 60% to have room for manoeuvre on your marketing and logistics costs.
Try copyfy for free
How to build your e-commerce dashboard
Tracking your KPIs in 5 different tools is the guarantee of not tracking anything at all. You need a centralized dashboard that brings together all your key indicators in one place.
Why centralize?
- Time saving: all your data at a glance
- Global vision: Understand the correlations between your KPIs
- Fast decision making: No need to juggle 10 tabs
- Monitoring the evolution: visualize your progress over time
The tools to connect
To have a complete dashboard, connect:
- Google Analytics 4 : traffic, user behavior, conversions
- Shopify (or your e-commerce platform) : sales, AOV, products
- Facebook Ads Manager : Facebook/Instagram ad performance
- Google Ads : Google/YouTube ad performance
- Klaviyo/Sendinblue : email performance, CLV
- (Optional) Triple Whale or Northbeam : unified multi-channel tracking
Recommended Solution: Google Looker Studio (free)
Looker Studio (formerly Google Data Studio) is the free tool par excellence for creating your personalized dashboard. It connects natively to all these tools.
How to do it?
- Create an account on Looker Studio
- Connect your data sources (GA4, Google Ads, Shopify via connector)
- Create your charts for each important KPI
- Organize them on a single dashboard
- Consult it every morning or every week according to your rhythm
👉 Download our free e-commerce KPI dashboard template and saves hours of configuration. Access the template
The 10 indicators to be displayed first
Don't overload your dashboard. Here are the 10 essential KPIs to keep in mind:
- Turnover (day/week/month)
- Number of orders
- Overall conversion rate
- Average basket (AOV)
- Customer acquisition cost (CAC)
- Average ROAS
- Cart abandonment rate
- Traffic by source
- CLV average
- Estimated net margin
Bonus: Add a “Goals” section to compare your current performance to your monthly goals.
Try copyfy for free
Benchmarks 2025 — Where do you compare to the market
Knowing your numbers is good, knowing if they are good is better. Here are the up-to-date e-commerce benchmarks for 2025, based on industry averages.
Average KPI 2025 Good Level Excellent Conversion Rate2.5-3% 4% 5% +Average basket (AOV)75-100€120-150€200+Cart abandonment rate70-76% 60-70% < 60%ROAS2:1 - 3:14:1 - 5:17:1 +CLV150-250€300-500€500+CAC40-60€25-40€<25€CLV/CAC ratio2:1 - 3:14:15:1 +Buy-back rate20-30% 35-40% 45% +Gross margin40-50% 60-70% 70% +Net margin5-10% 15-20% 25% +
How to interpret these benchmarks?
Attention: These numbers are general averages. Your sector may have different standards:
- Cosmetics/beauty: higher margins, higher CLV
- Electronics: lower margins, high average baskets
- Fashion/accessories: high return rate, strong loyalty
- Home/decor: Medium-high carts, long buying cycles
The essentials: Compare yourself to yourself first. Are you improving month after month? That's what counts.
Try copyfy for free
The essential tools to monitor your KPIs
Here is the ideal data stack for an e-merchant who wants to manage his business seriously, without breaking the bank.
Free tools (essential)
1. Google Analytics 4 (GA4)
- What it does: Full analysis of traffic, user behavior, conversions
- For whom: Everyone, it's the base
- Price: Gratuit
- Our opinion: Complex at first but essential. Take the time to set it up properly.
2. Shopify Analytics/WooCommerce Reports
- What it does: Native dashboard for your e-commerce platform
- For whom: Shopify, WooCommerce, PrestaShop users
- Price: Included in your subscription
- Our opinion: Perfect for basic KPIs (sales, orders, top products). Limit for multi-channel attribution.
3. Google Looker Studio
- What it does: Creating custom dashboards
- For whom: Those who want to centralize all their data
- Price: Gratuit
- Our opinion: Ultra-powerful free tool, perfect for creating your unique dashboard.
Paid tools (to go further)
4. Triple Whale/Northbeam (180-300€/month)
- What it does: Advanced multi-channel tracking, accurate attribution, real-time dashboard
- For whom: Shops with advertising budget >10k€/month
- Our opinion: Essential when you scale and need precise attribution (iOS14+ has broken Facebook tracking).
5. Klaviyo (free up to 250 contacts, then ~35€/month)
- What it does: Email marketing + segmentation + CLV/retention tracking
- For whom: Any store that wants to retain its customers
- Our opinion: The best email tool for e-commerce. Automatic segments are a gold mine for analyzing your customers.
6. Hotjar/Microsoft Clarity (free/paid)
- What it does: Heatmaps, session recordings, behavioral analysis
- For whom: Those who want to understand WHY their visitors don't convert
- Our opinion: Clarity is free and more than enough to get started. Heatmaps reveal insights that are invisible in GA4.
Recommended stack according to your level
Beginner (0-5k€/month):
- Google Analytics 4
- Shopify native dashboard
- Microsoft Clarity
Intermediate (5-30k€/month):
- GA4
- Shopify + Looker Studio
- Klaviyo
- Facebook Ads Manager
Advanced (30k€+CAD/month):
- GA4+ Triple Whale/Northbeam
- Looker Studio (custom dashboard)
- Klaviyo
- Hotjar
Try copyfy for free
Best practices for an effective data-driven strategy
Having tools and KPIs is good. Knowing how to use them to make better decisions is better. Here are the 7 best practices of e-retailers that really drive by data.
1. Align your KPIs with your business goals
The trap: Track dozens of metrics “because you have to.”
The right approach: Define your main objective for the quarter and select the 3-5 KPIs that contribute directly to it.
Examples:
- Objective: Increase turnover → KPI: Traffic, Conversion rate, AOV
- Objective: Improve profitability → KPI: ROAS, Gross margin, CAC
- Objective: Retain customers → KPI: Buy-back rate, CLV, Churn rate
2. Follow maximum 10 indicators (not 50)
The trap: Wanting to measure everything and end up paralyzed by the numbers.
The rule: Identify your 10 essential KPIs and focus on them. The rest is noise.
The 10 KPIs to follow as a priority:
- Turnover
- Number of orders
- Conversion rate
- Average basket (AOV)
- CAC
- ROAS
- Cart abandonment rate
- CLV
- CLV/CAC ratio
- Net margin
3. Compare MoM (Month over Month) and YoY (Year over Year)
The trap: Panic about a daily or weekly drop.
The right approach: Look at the evolution month by month (MoM) and year by year (YoY) to identify real trends.
Example:
- Sales down 15% this week vs last week → maybe normal (seasonality)
- Sales down 15% this month vs same month last year → problem to investigate
Everyday data is too volatile. Monthly and annual trends reveal the true health of your business.
4. Segment your data (channels, devices, countries)
The trap: Look at global numbers only.
The right approach: Break your KPIs into segments to identify where your strengths and weaknesses are.
Essential segmentations:
- By acquisition channel : Instagram vs Google vs Email vs Direct
- By device : Mobile vs Desktop vs Tablet
- By geography : France vs Belgium vs Switzerland vs International
- By type of customer : New vs Recurring
- By product category : Bestsellers vs New Arrivals vs Promo
Concrete example:You have an overall conversion rate of 2.8%, but by segmenting:
- Instagram traffic: 1.5% conversion
- Email traffic: 6.2% conversion
- Google traffic: 3.8% conversion
→ Action: Invest more in email and Google, optimize or reduce Instagram.
5. From data to decision
The trap: Collect data without ever acting on it.
The golden rule: For each KPI you follow, define in advance what action you will take based on its value.
Example of action rules:
KPICurrent ValueAlert Threshold Automatic ActionROAS Facebook3,2<2,5Campaign pause + creative analysisCart abandonment rate 78% > 75% Launch recovery email + check postageMobile conversion rate 1.8% < 2% Mobile UX audit + simplify checkout
Turn your dashboard into operational dashboard, not just in terms of numbers.
6. Consult your KPIs on a regular basis (ritual)
The trap: Look at your stats only when you think about them (or when you're feeling bad).
The good habit: Create a ritual to consult your KPIs.
Recommended pace:
- Daily (5 min) : CA, orders, ROAS (if you advertise actively)
- Weekly (30 min) : All acquisition and conversion KPIs, campaign analysis
- Monthly (2 hours) : Complete review of all KPIs, comparison of objectives, action plan for the following month
Tip: Schedule a recurrence in your agenda. “Monday 9 am: Weekly KPI review”.
7. Document your learning and tests
The trap: Test lots of things without ever noting the results.
The right approach: Keep a log of your tests and optimizations.
Simple format:
- Date
- Test carried out (e.g.: new Facebook creative)
- Hypothesis (ex: “video with UGC will convert better”)
- KPI monitored (ex: ROAS)
- Result (e.g. ROAS increased from 3.2 to 4.8)
- Apprenticeship (e.g. “UGC > classic product photos”)
- Action (e.g. create more UGC videos)
Why? Because in 6 months, you won't remember what worked and what didn't. This doc becomes your strategic guide.
Try copyfy for free
Transform your data into growth
KPIs are useless if they don't guide your decisions. This is rule #1 of effective e-commerce management.
What we saw together:
- The 4 main families of KPIs (acquisition, conversion, loyalty, profitability)
- The 7 essential indicators that you should definitely follow
- How to build a centralized dashboard
- The 2025 benchmarks to locate you
- The essential tools according to your level
- Best practices for turning data into action
Now it's up to you to play:
- This week: Identify your 10 priority KPIs according to your current objective
- This month: Set up your centralized dashboard (Looker Studio or similar tool)
- The next 3 months: Review your KPIs every week and make decisions based on data
Remember: successful online retailers are not the ones with the most data, but the ones who know what to do with it.
Gemini Feedback:
It's a great starting point. Your content is dense, actionable and very well structured. It already meets much of the research intent we identified.
As an expert, I will now analyze your text by comparing it directly to the expectations of the user. I'm going to identify what is wordperfect (and fully meets the intent) and what could be optimized to turn it into an essential guide.
Critical analysis of your content (Strengths vs Optimization Axes)
1. The Intent: “I am drowned, give me a filter”
- What's great (✅):
- The "⚡ In a nutshell” block: It's the best part of your introduction. It acts like a immediate filter. You give the 5 golden rules before you even start. The “Winning Trio: CAC < Margin < CLV” and the “4:1 ROAS Rule” are exactly the type of “signal” the user is looking for.
- “Focus on 10 KPIs maximum”: You address the main “bread point” (embedded in the data) from the first line. It is perfect.
- The introduction (“You spend hours... “): It perfectly describes the user's pain. He feels understood.
- What can be optimized (💡):
- Nothing on that point. The hook and promise are perfectly aligned with the research intent.
2. The Expected Answers: “The list, the formulas and the actions”
- What's great (✅):
- The structure: The division into 4 families (Acquisition, Conversion, Retention, Profitability) is clear and logical. It is the expected structure.
- The details of the KPIs: For each KPI, you follow the winning formula: Definition + Formula + Where to find it + Benchmarks + Concrete action. It's the core value of your item.
- The “Concrete Actions”: They are accurate. “If your rate is below 2.5%, there is friction...” transform data into an action plan. That is exactly what the user wants.
- The 2025 Benchmarks: The addition of recent numbers (“What is a good number?”) is a major strong point. This provides a crucial context.
- What can be optimized (💡):
- Lack of a fundamental KPI: the Average Order (AOV). You mention it in the CLV formula and in the dashboard, but it deserves its own detailed section just like the Conversion Rate. It is the second major driver of profitability (easier to increase the AOV than the Conversion Rate).
- Missing the “Traffic”: This is the basic acquisition KPI. You mention it, but it deserves a mini-section: “Traffic by source” (SEO, SEA, Social, Email) to show where the user has to look to find out where their world comes from.
3. The Format: “An easy to scan guide and a dashboard”
- What's great (✅):
- The “Ultimate Guide” format: It's a long, well-structured article with clear titles ($H2$, $H3$), bulleted lists and 💡 “Pro tips”. It is easy to scan.
- The “How to build your dashboard” section: It is an excellent response to the expectation of a “dashboard”. You recommend the tool (Looker Studio), list the connections and give the 10 priority KPIs to put there. It's a huge added value.
- The “Tools” section: The segmentation (Free/Paid) and by level (Beginner/Intermediate/Advanced) is very relevant for your target audience.
- What can be optimized (💡):
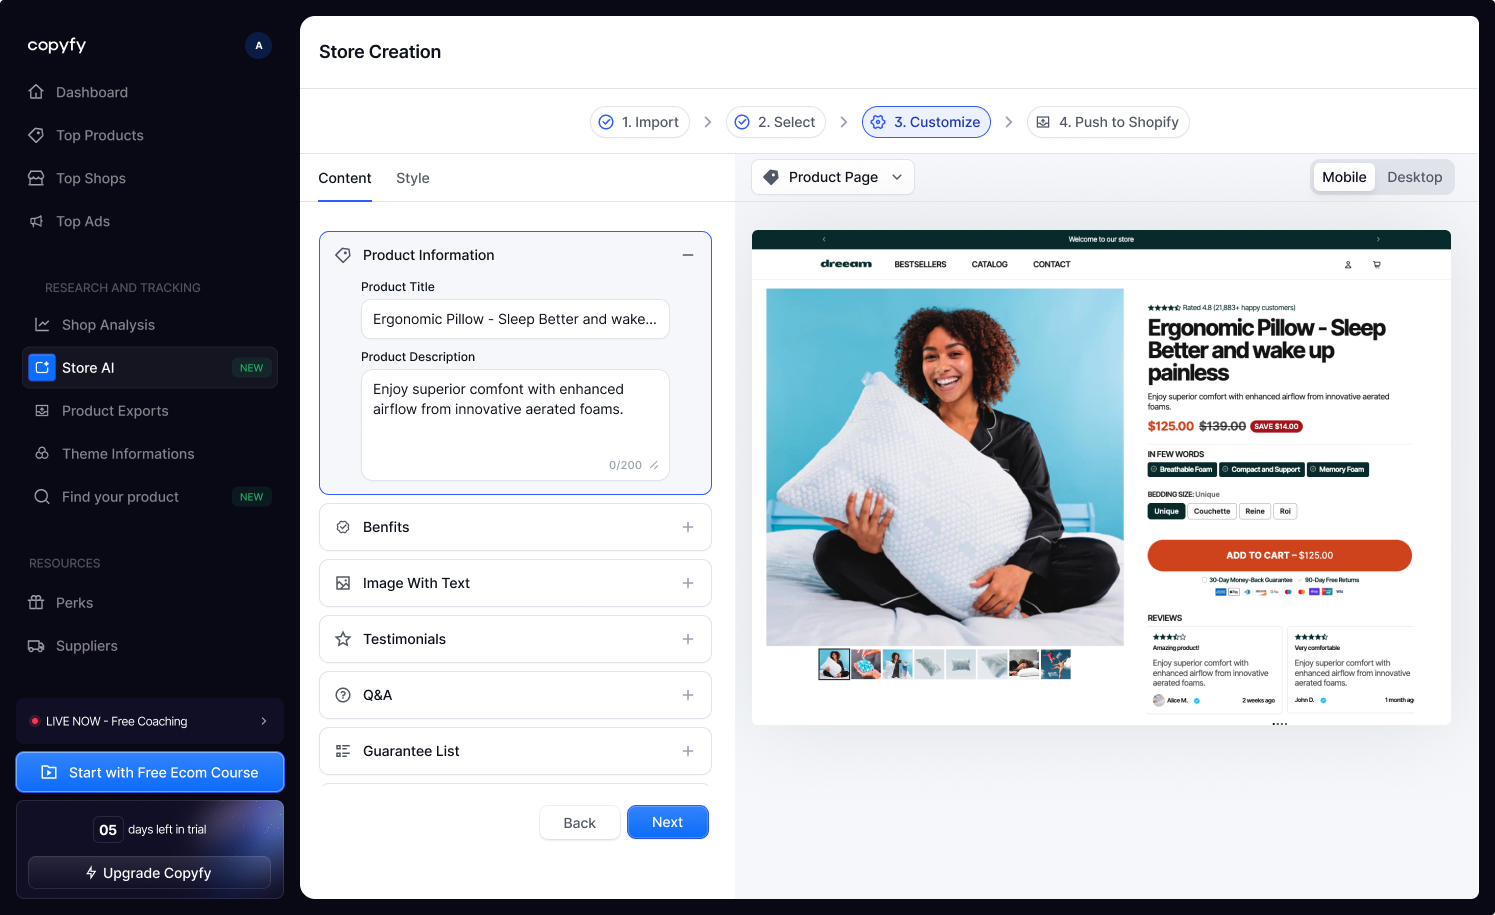
- Visuals: The content is very textual. For a perfect answer, there are missing visuals. The user expects to see:
- An example of a dashboard: A screenshot (even blurred or generic) of what a good Looker Studio dashboard looks like.
- Schematics: A visual of the “conversion tunnel” (Traffic > Add Cart > Cart > Checkout > Thank you) with the associated KPIs (Conversion Rate, Abandonment Rate).
- The table “The 4 main families” would benefit from being a real HTML table or an image/infographic.
- Visuals: The content is very textual. For a perfect answer, there are missing visuals. The user expects to see:
4. Sources and Data: “Reliability and timeliness”
- What's great (✅):
- News: You mention “GA4", “Benchmarks 2025", “Looker Studio”, “Triple Whale”, the “iOS14" impact. It shows that the content is up to date and credible.
- Authority: The tone is direct (“You”), confident, and expert. The “Pro tips” and the rules (ROAS 4:1, 3:1 ratio) establish this authority.
- The “Try Copyfy” CTAs: They are well integrated. You are not selling a product, you are offering a tool that seems to be related to the subject, which is logical.
- What can be optimized (💡):
- Source of the benchmarks: You're quoting “based on industry averages.” If you could be slightly more precise (e.g. “based on studies by Shopify and Littledata for 2025”) or even link to an external source, this would further strengthen credibility. But that is a detail.